Closing the Data Gap with Real-Time Logistics Dashboards
By Randy Nation | June 30, 2026
I have sat in the seat.
As Vice President of Supply Chain Operations at GXO Logistics, I managed a multi-client portfolio supporting Apple, Google, and Comcast.
Before that, as Senior Director at XPO, I oversaw a $1.2 billion customer inventory portfolio across 15 data centers, two warehouse hubs, and two overflow facilities — a workforce of more than 2,100 people.
In that world, technology was not a nice-to-have. It was the difference between controlling your operation and being controlled by it.
When I founded TekNation, I made a deliberate decision to bring that operational DNA into the way we serve clients. Most IT companies will tell you they understand your business. We have actually run it.
The Problem Most 3PL Technology Partners Miss
The 3PL and warehousing environment is one of the most operationally demanding in any industry. You are managing client SLAs, multi-shift workforces, inventory accuracy, carrier performance, and safety compliance — all simultaneously, often across multiple facilities.
What most technology vendors do not understand is that in this environment, data latency is not just an inconvenience. It is a liability. When a production manager walks into a morning standup and the numbers on the screen are from yesterday, decisions get made on stale information. Inventory reconciliation falls behind. Delivery commitments slip. Clients escalate.
The executives I worked alongside at GXO and XPO did not need more data. They needed the right data, organized around clear accountability, available in real time. That is the problem TekNation is built to solve.
The Executive Dashboard Framework That Actually Works
During my time in value stream leadership, I structured operational visibility around a framework that divided accountability clearly using a RACI model. Every metric had an owner. Every owner had a dashboard. Every dashboard told the same story at a different altitude.
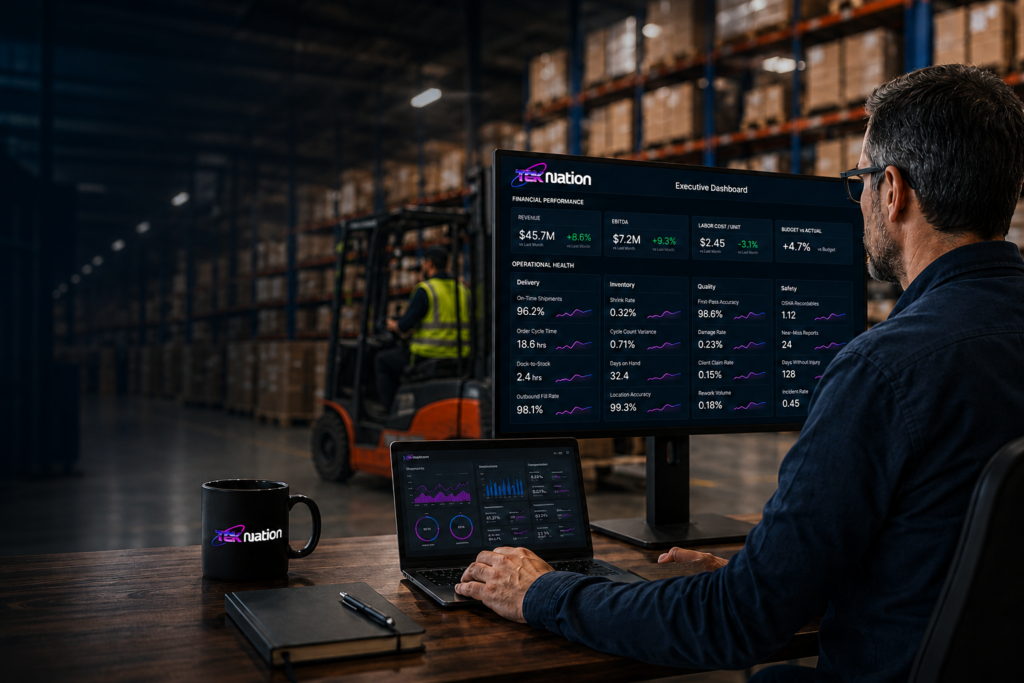
At the executive level, that framework organized around two categories: Financial Performance and Operational Health.
Financial Performance
Revenue and EBITDA are the top-line metrics every 3PL executive watches. But the mistake most operators make is treating these as lagging indicators reviewed monthly in a finance meeting. By the time those numbers land in a report, the decisions that drove them are three to four weeks old.
The goal is to make revenue and EBITDA visible as leading indicators, connected to the operational metrics driving them in real time. When labor cost per unit starts climbing on Tuesday morning, your EBITDA for the week is already at risk. A well-built executive dashboard surfaces that connection before the damage is done.
Operational Health
Operational health in a 3PL or warehouse environment breaks into four pillars. If you have spent time in lean operations or value stream management, these will be familiar:
📦 Delivery
Are commitments being met? On-time shipment rates, order cycle time, dock-to-stock performance, and outbound fill rates are the core metrics here. Delivery is the pillar your clients measure you by — and the one that drives contract renewals or losses.
🗄️ Inventory
Inventory accuracy is the foundation everything else is built on. Shrink rates, cycle count variance, days on hand, and location accuracy belong here. At XPO, recovering over $7 million in lost inventory was not a technology problem — it was a visibility problem. The right data model, surfaced in real time, would have caught those variances weeks earlier.
✅ Quality
First-pass accuracy, damage rates, rework volume, and client claim rates define your operational reputation. Quality issues that surface at the client are almost always visible earlier in the process — if you know where to look.
🦺 Safety
Incident rates, near-miss reporting, days without injury, and OSHA recordables are non-negotiable in a high-volume warehouse environment. Safety metrics belong on the executive dashboard because safety performance is both a moral obligation and a direct driver of labor cost and liability exposure.
Executive Dashboard: Key Metrics by Pillar
| Financial | Delivery | Inventory | Quality / Safety |
|---|---|---|---|
| Revenue | On-Time Shipments | Shrink Rate | First-Pass Accuracy |
| EBITDA | Order Cycle Time | Cycle Count Variance | Damage Rate |
| Labor Cost/Unit | Dock-to-Stock | Days on Hand | OSHA Recordables |
| Budget vs. Actual | Outbound Fill Rate | Location Accuracy | Near-Miss Reports |
Your ERP Is Already a Data Source
One of the most underutilized assets in a 3PL or warehouse operation is the data already sitting inside your ERP system — or your client’s. Whether you are running SAP, Oracle, NetSuite, or a warehouse-specific platform like Manhattan or Blue Yonder, that system is capturing transactional data that tells the operational story in real time. The problem is that most organizations never get that data out of the ERP and into a format that drives daily decisions.
The same is true on the client side. When you are managing inventory on behalf of a major brand, their ERP is the system of record for orders, receipts, and inventory positions. Connecting Power BI to those data streams — whether through a direct connector, an API, or a flat file export — means your dashboard reflects the same numbers your client is looking at. That alignment eliminates one of the most common sources of friction in 3PL client relationships: the data disagreement.
TekNation has the technical capability to connect Power BI to a broad range of ERP systems without requiring a full system replacement or a custom development project. We meet your data where it lives.
Where Microsoft 365 and Power BI Fit In
Most 3PL companies and warehouse operations in the 10 to 100 employee range are not running custom ERP dashboards with dedicated BI teams. They are running a combination of WMS reports, spreadsheets, email threads, and tribal knowledge. The morning standup runs off a spreadsheet someone updated at midnight.
Microsoft 365 Business Premium, paired with Power BI, changes that equation without requiring an enterprise-scale technology investment. Here is what that looks like in practice:
- Power BI connects to your existing data sources. WMS, ERP, Excel files on SharePoint — no system replacement needed. Power BI pulls everything into a unified dashboard.
- Real-time dashboards replace the morning spreadsheet. Delivery performance, inventory variance, quality metrics, and open safety items are already on screen when your team walks in — current as of the last refresh. The conversation shifts from reporting what happened to deciding what to do.
- The RACI framework becomes dashboard architecture. Each pillar — Delivery, Inventory, Quality, Safety — becomes a section with an owner who can drill into the data when something needs attention.
- Microsoft Intune and Entra ID secure the operation. In a 3PL environment, you handle client data for major brands with strict security requirements. TekNation manages device compliance, MFA enforcement, and access controls so your team can focus on the operation.
The Value Stream Lens
One of the most powerful tools I used throughout my career was the value stream map. Before you can build a meaningful dashboard, you have to understand the process it is measuring. Where does work enter the system? Where does it stall? Where are the handoffs that create variance?
At TekNation, we bring that value stream discipline to the technology engagements we take on with 3PL and warehouse clients. We do not just install software and walk away. We work with your team to map the operational processes, identify the metrics that matter at each stage, and build the data infrastructure that makes those metrics visible.
That is not something most MSPs can offer. It comes from having designed and led these operations firsthand.
Process Mapping as a Starting Point
If your operation is running on disconnected systems and informal reporting, a process map is often the right first step before any technology investment. Understanding how information flows through your facility — from receiving to put-away to pick, pack, and ship — reveals where the visibility gaps are and what data needs to be captured to close them.
TekNation can facilitate that process mapping exercise as part of an engagement. For clients coming from more mature operational environments, we can move directly to data model design and dashboard build. Either way, the goal is the same: an operation where every leader has the visibility they need to make fast, confident decisions.
What This Means for Your Business
If you are running a 3PL or warehouse operation and your technology feels like it is working against you rather than for you, the problem is usually not the tools. It is the architecture.
The right combination of Microsoft 365, Power BI, and a well-structured data model can give a 50-person operation the same operational visibility that enterprise companies spend millions of dollars to build.
TekNation brings the technical capability to build that infrastructure and the operational experience to make sure it reflects how your business actually runs. We are based in Douglasville, GA and serve businesses across the greater Atlanta area and beyond.
If you are ready to move your morning standup from a spreadsheet review to a real-time operational conversation, we would like to talk.
Randy Nation is the founder of TekNation, a Microsoft-focused managed services provider serving small and mid-size businesses. He brings 15 years of VP-level supply chain and logistics leadership from GXO Logistics, XPO, and The Boeing Company.