
Transforming Manufacturing Returns Into Actionable Data
By TekNation
In manufacturing, a product return is not just a customer service event. It is a data point. Every unit that comes back from the field carries information about what failed, when it failed, how it was used, and what process or material decision produced it. The question is whether your organization captures that information and acts on it, or whether the return gets processed, the credit gets issued, and the failure mode disappears into a spreadsheet that nobody reviews until the same problem generates enough warranty claims to demand attention.
Reverse logistics in manufacturing is inseparable from quality management. The warranty risk matrix, the DPU framework, and the inventory accuracy model we have built throughout this series all connect directly to what happens when a product comes back. This article describes how TekNation closes that loop, building a reverse logistics data model that feeds your quality intelligence system in real time rather than in arrears.
A return that is processed without being analyzed is a missed opportunity. A return that feeds the warranty risk matrix, the DPU model, and the supplier quality scorecard simultaneously is a quality intelligence asset.
The Manufacturing Reverse Logistics Workflow
Unlike a 3PL operation where returns arrive from end consumers across a wide product range, manufacturing reverse logistics typically involves warranty replacements, field service returns, customer-reported defects, and end-of-life product recovery. Each type carries different data requirements and different downstream implications for the quality organization.
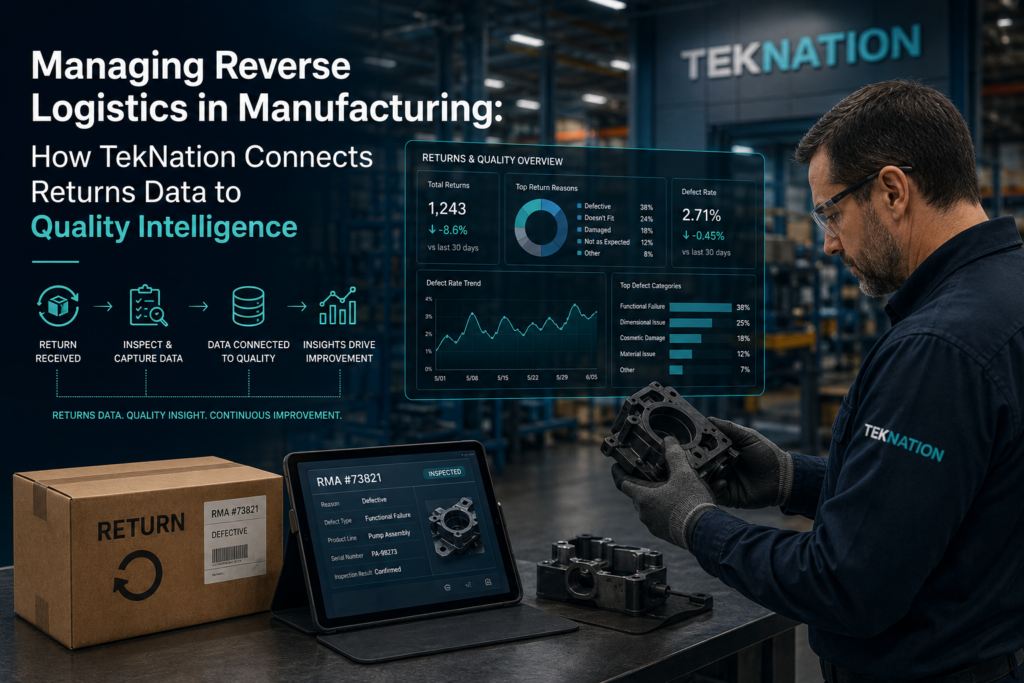
A structured manufacturing reverse logistics process moves every returned unit through five defined stages:
- Warranty claim and RMA initiation. The process begins when a customer submits a warranty claim or a field service team initiates a return. The RMA links the physical unit to the original work order, the production date, the lot or batch number, and the failure description. This linkage is critical: without it, the returned unit cannot be traced back to the production variables that may have caused the failure.
- Inbound receiving and unit tagging. The returned unit is received, tagged with its RMA number, and logged into the reverse logistics queue. At this stage, the unit’s condition is assessed visually and its failure description from the customer is confirmed or amended. Every unit that enters the queue should have a defined disposition target date: the date by which a disposition decision must be made.
- Failure analysis and root cause coding. The quality engineering team performs failure analysis on the returned unit and assigns a root cause code: design defect, manufacturing process escape, material nonconformance, customer misuse, or no defect found. This coding is the most operationally valuable data point in the entire reverse logistics process. It is the data that feeds the DPU model, informs the warranty risk matrix, and drives supplier quality chargebacks.
- Risk score assessment. Each returned unit and its failure mode is scored against the warranty risk matrix introduced in Part One of this series. Probability is assessed based on how frequently this failure mode has appeared across the return queue. Severity is calculated from the safety, cost, defect rate, and volume exposure sub-scores. The resulting risk score determines whether the return is a normal processing event, a monitored trend, a quality engineering investigation trigger, or a potential recall assessment.
- Disposition and value recovery. Based on the failure analysis and risk assessment, each unit is routed to one of four disposition paths: repair and retest for units that can be returned to service, parts cannibalization for units whose components have remaining value, supplier chargeback and return for units where the root cause traces to a nonconforming material or component, or scrap and disposal for units with no recoverable value.
Connecting Returns Data to the Quality Intelligence Framework
The most powerful aspect of TekNation’s reverse logistics model for manufacturing is not the returns processing workflow itself. It is how the returns data connects to the quality intelligence framework already in place from earlier in this series.
Feeding the Warranty Risk Matrix
Every return processed through the reverse logistics queue updates the warranty risk matrix automatically. The root cause code and the failure mode frequency from the return queue feed the Probability dimension. The failure’s safety impact, cost exposure, defect rate, and volume data feed the Severity calculation. When five returns with the same root cause code arrive within a 30-day window, the risk score for that failure mode escalates from Low to Medium or High without waiting for a monthly quality review meeting to notice the trend.
Feeding the DPU Model
Returns with root cause codes traced to a manufacturing process escape are fed back into the DPU model as confirmed field defects. This closes the loop between in-process defect detection and field failure rates. A facility tracking DPU carefully on the production floor but not connecting field returns to the same model has an incomplete picture. Field returns are defects that passed inspection. Adding them to the DPU model gives quality engineering a true defect rate that includes both detected and escaped defects, which is a more honest and actionable quality metric.
Driving Supplier Quality Chargebacks
Returns with root cause codes traced to material nonconformance generate automatic supplier quality alerts in the data model. The affected lot, the incoming inspection record, and the field failure documentation are pulled together into a supplier chargeback package that the procurement team can review and submit without manually assembling documentation from multiple systems. For manufacturers managing dozens of supplier relationships, this automated chargeback pipeline recovers significant cost that would otherwise be absorbed internally.
The Metrics That Drive Manufacturing Reverse Logistics Performance
TekNation builds manufacturing reverse logistics dashboards around the metrics that connect returns performance to the broader quality management picture:
- Field return rate by product family and production period. The percentage of shipped units that are returned under warranty, tracked by product line, production date range, and customer segment. Rising field return rates tied to a specific production period are the earliest possible signal of a systemic quality escape.
- Root cause distribution. The breakdown of returns by root cause category: design, process, material, misuse, or no defect found. A shift toward process or material root causes demands a quality engineering response. A high no-defect-found rate may indicate a customer education issue or a field service diagnosis problem rather than a manufacturing defect.
- Cost of poor quality from field returns. The total warranty cost incurred from field returns, including repair labor, replacement units, freight, and customer accommodation costs. Connected to the DPU model and the warranty risk matrix, this metric shows quality leadership and operations finance the total financial exposure of the current quality posture.
- Supplier chargeback recovery rate. The percentage of warranty costs attributable to supplier nonconformance that are successfully recovered through chargebacks. This metric measures both the accuracy of the root cause analysis process and the effectiveness of the supplier quality management program.
- Return disposition cycle time. The elapsed time from RMA receipt to final disposition decision. Aging returns in the failure analysis queue delay risk score updates in the warranty matrix and slow supplier chargeback processing. Alerts trigger when returns exceed their disposition target date.
How the Complete Quality Intelligence Loop Works
With the reverse logistics module in place alongside the warranty risk matrix, DPU model, and inventory accuracy framework from earlier in this series, the quality intelligence loop is complete. Production floor defects feed the DPU model. Inventory accuracy feeds the production planning and warranty risk models. Warranty risk scores drive escalation and investigation decisions. Field returns feed both the warranty risk matrix and the DPU model with confirmed field failure data. Supplier chargebacks close the upstream loop by holding the supply chain accountable for material quality.
Every data point in this framework connects to every other. A return that arrives on Wednesday morning can update the warranty risk score, escalate to quality engineering, and trigger a supplier chargeback investigation before the end of the same shift. That is not a theoretical capability. It is what TekNation builds.
Getting Started
TekNation begins every manufacturing reverse logistics engagement by mapping how returns data currently flows through the organization: where RMAs are initiated, how failure analysis results are recorded, where disposition decisions are tracked, and how warranty cost data reaches the financial team. In most manufacturing operations, the data exists. The integration to the quality intelligence framework does not.
For operations already running the warranty risk matrix or DPU dashboard from earlier in this series, the reverse logistics module integrates into the existing data model without requiring a separate build. The connection points are already defined. The returns data fills them in.
We are based in Douglasville, GA and serve manufacturing businesses throughout the greater Atlanta area and beyond. Reach out to schedule a reverse logistics data assessment.
TekNation is a Microsoft-focused managed services provider based in Douglasville, GA, serving manufacturing and logistics businesses with 1 to 100 employees. We specialize in Microsoft 365, Power BI, Power Automate, and operational intelligence solutions built for the production floor.
Ready to close the quality intelligence loop with reverse logistics data? Contact TekNation today.